Builds a consonance object from draws of a confidence distribution
obtained by simulation: for example a generalized fiducial distribution
sampled with Stan, a bootstrap distribution, or any other Monte Carlo
approximation whose quantiles are to be read as confidence limits. The
limits of the interval at each level are the corresponding sample
quantiles of the draws, so the \(100(1-\alpha)\%\) interval is
\([Q(\alpha/2), Q(1-\alpha/2)]\). The output has the same structure
as that of curve_gen() and curve_analytic(), so ggcurve(),
curve_compare(), plot_compare(), and curve_table() work unchanged.
curve_stan(draws, steps = 1000, table = TRUE)Arguments
- draws
A numeric vector of draws from the confidence distribution of the parameter of interest.
- steps
Indicates how many consonance intervals are to be calculated at various levels. By default, it is set to 1000.
- table
Indicates whether or not a table output with some relevant statistics should be generated. The default is TRUE and generates a table which is included in the list object.
Value
A list with 3 items where the dataframe of values is in the
first object, the values needed to calculate the density function in
the second, and the table for the values in the third if
table = TRUE.
Details
No Stan installation is needed for this function. curve_stan_fit()
wraps the sampling step for users who have rstan installed.
A confidence distribution is a sample-dependent distribution function on the parameter space whose quantiles are confidence limits at every level (Xie & Singh, 2013). When it is available only as Monte Carlo draws, the empirical quantiles converge to the true limits, with Monte Carlo error that is largest in the extreme tails. Use enough draws (tens of thousands) if the 99\
Whether a set of draws is a valid confidence distribution is a property of how the draws were generated, not of this function: a Bayesian posterior under an informative prior, for example, generally is not one. Generalized fiducial distributions (Hannig et al., 2016) and posteriors under matching priors are the usual sources.
References
Xie M, Singh K. Confidence distribution, the frequentist distribution estimator of a parameter: a review. Int Stat Rev. 2013;81(1):3-39.
Hannig J, Iyer H, Lai RCS, Lee TCM. Generalized fiducial inference: a review and new results. J Am Stat Assoc. 2016;111(515):1346-1361.
Schweder T, Hjort NL. Confidence, Likelihood, Probability. Cambridge University Press; 2016.
See also
curve_stan_fit() to sample a bundled or user-supplied Stan
model with rstan; curve_analytic() for closed-form curves.
Examples
# Draws from the exact confidence distribution of a normal mean with
# n = 12: t_{11} scaled by the standard error.
set.seed(4821)
y <- rnorm(12, 3.2, 1.4)
draws <- mean(y) + sd(y) / sqrt(12) * rt(20000, df = 11)
cd <- curve_stan(draws)
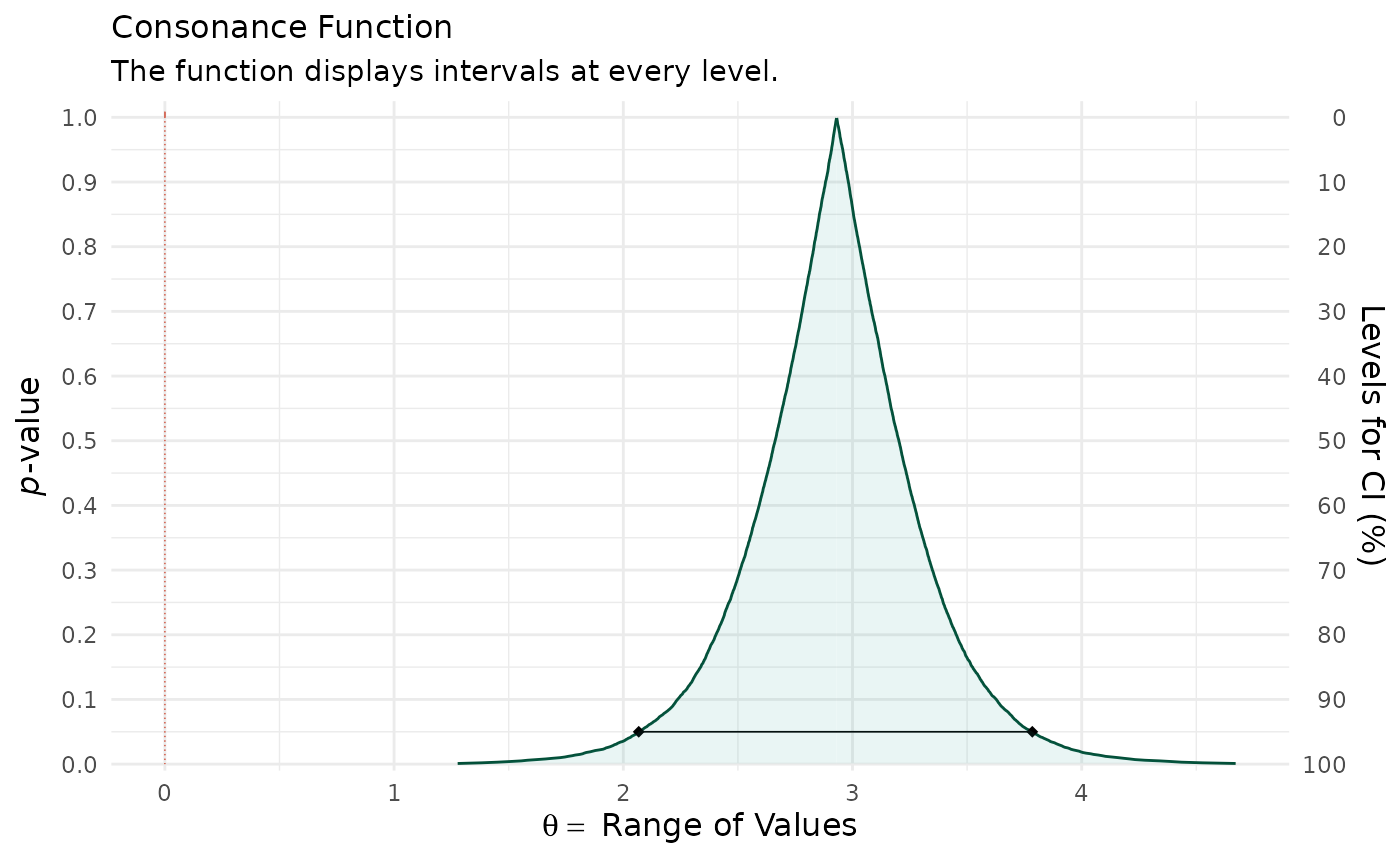
ggcurve(cd[[1]], type = "c", nullvalue = 0)
 # Agrees with the analytic t-based curve
an <- curve_analytic(mean(y), se = sd(y) / sqrt(12), df = 11, dist = "t")
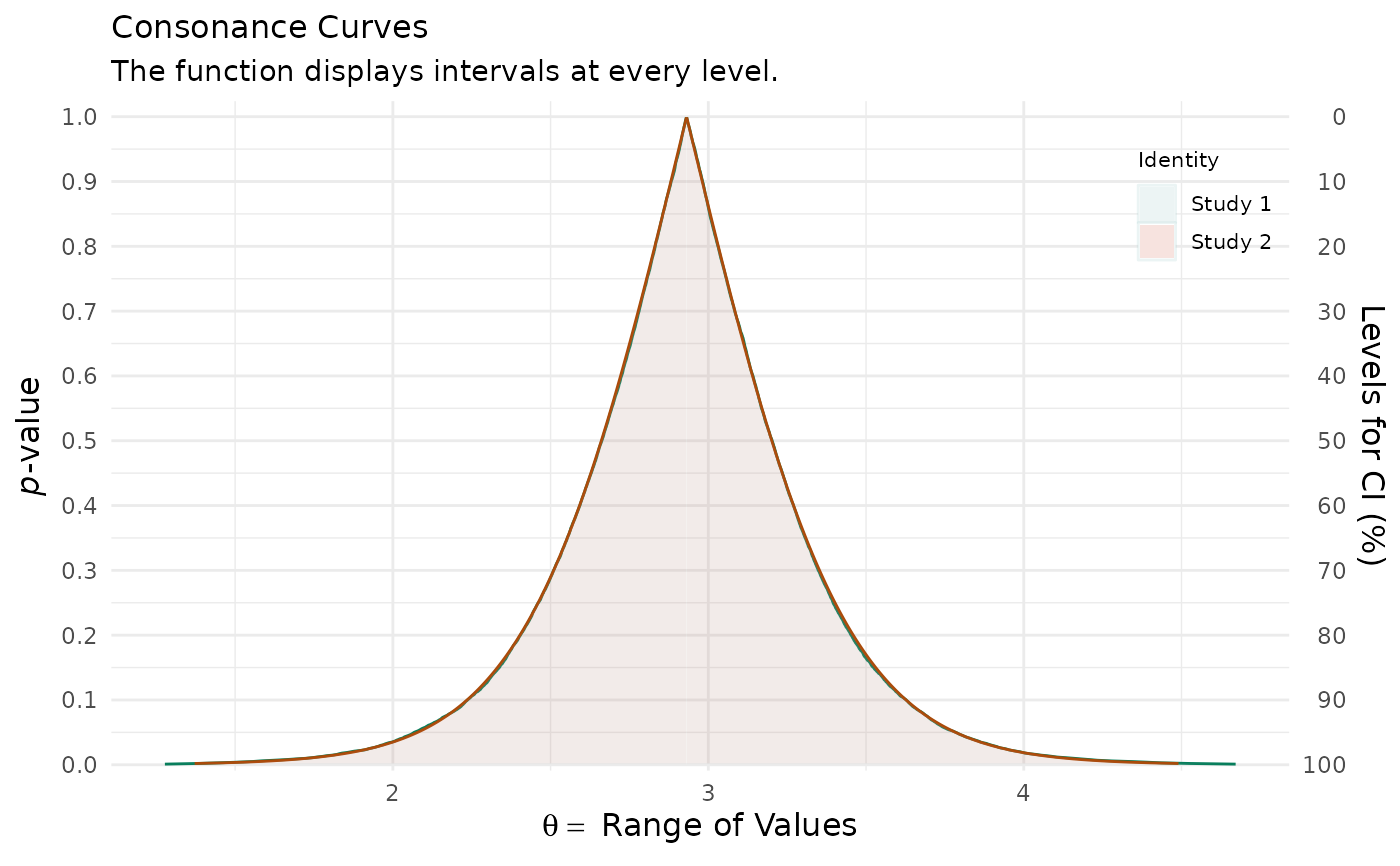
plot_compare(cd[[1]], an[[1]], type = "c")
# Agrees with the analytic t-based curve
an <- curve_analytic(mean(y), se = sd(y) / sqrt(12), df = 11, dist = "t")
plot_compare(cd[[1]], an[[1]], type = "c")