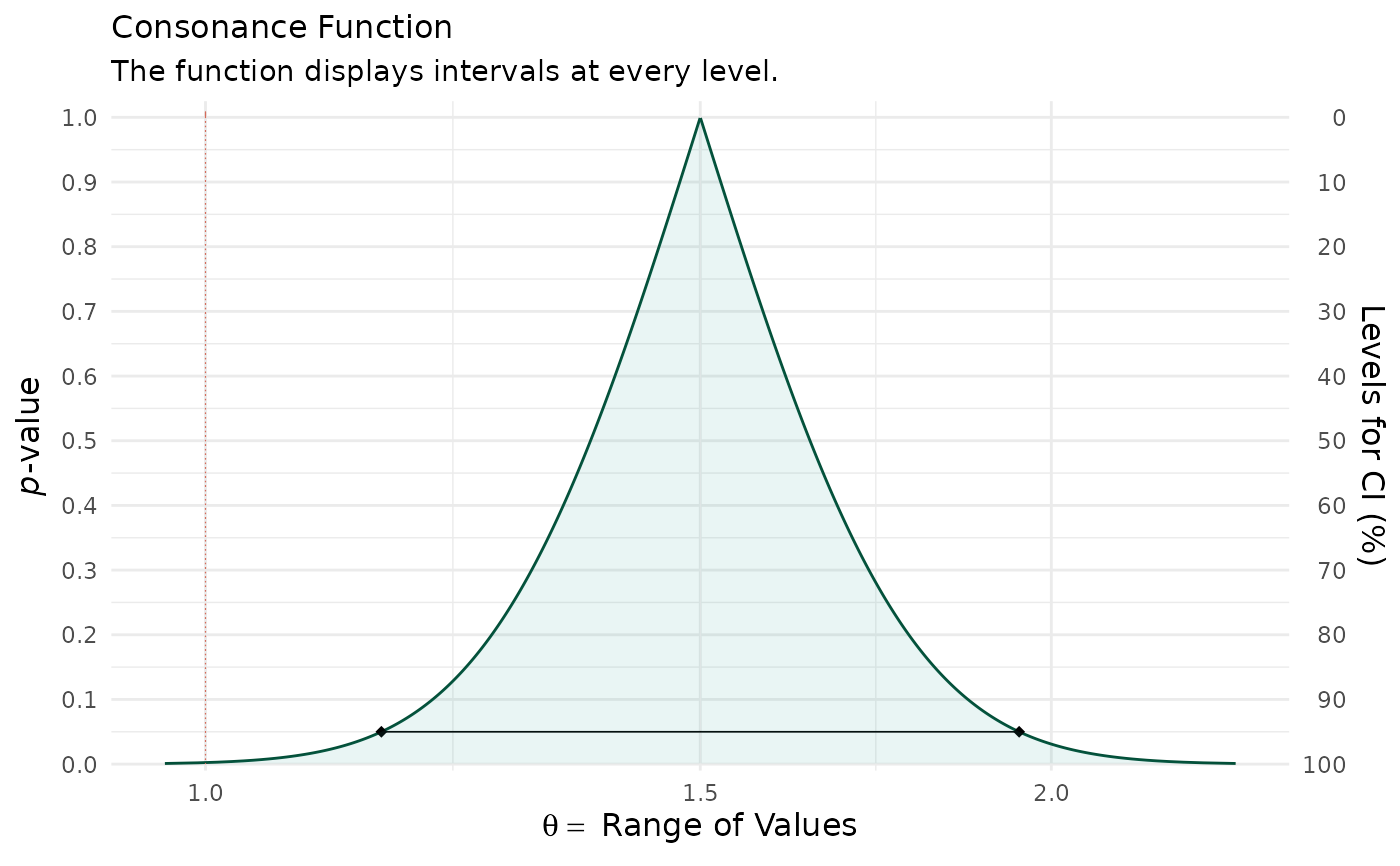
Convenience function to construct consonance functions given a point estimate and its standard error.
curve_from_se(estimate, se, measure = "mean", steps = 1000,
  cores = getOption("mc.cores", 1L), table = TRUE)
Arguments
- estimate
Point estimate.
- se
Standard error of the estimate.
- measure
Type of measure: "mean" for differences (default), "ratio" for ratio measures (estimate should be on original scale).
- steps
Number of consonance levels to compute. Default is 1000.
- cores
Number of cores for parallel computation.
- table
Logical. If TRUE (default), includes a summary table.
Value
A list with class "concurve" containing the intervals dataframe, density dataframe, and optionally a summary table.
Details
This function constructs consonance intervals using the normal approximation:
estimate +/- z * se where z varies across confidence levels.
For ratio measures, the function handles the log transformation internally.
See also
curve_from_ratio() for constructing from CI bounds
curve_rev() for the underlying function
Examples
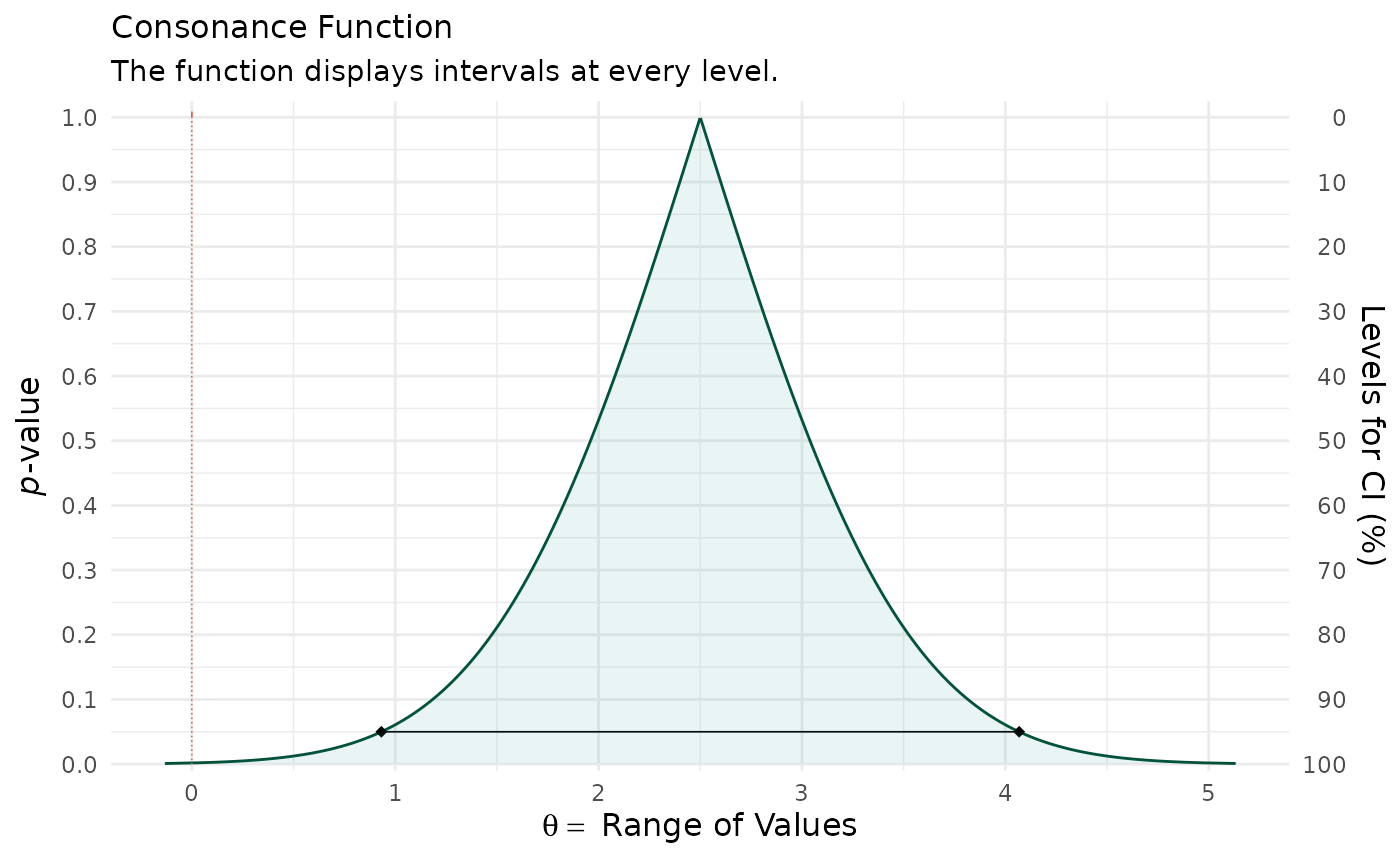
# A mean difference of 2.5 with a standard error of 0.8
curves <- curve_from_se(estimate = 2.5, se = 0.8, measure = "mean")
curves[[3]]
#> Lower Limit Upper Limit Interval Width Interval Level (%) CDF P-value
#> 750 2.245 2.755 0.510 25.0 0.625 0.750
#> 500 1.960 3.040 1.079 50.0 0.750 0.500
#> 250 1.580 3.420 1.841 75.0 0.875 0.250
#> 200 1.475 3.525 2.050 80.0 0.900 0.200
#> 150 1.348 3.652 2.303 85.0 0.925 0.150
#> 100 1.184 3.816 2.632 90.0 0.950 0.100
#> 50 0.932 4.068 3.136 95.0 0.975 0.050
#> 25 0.707 4.293 3.586 97.5 0.988 0.025
#> 10 0.439 4.561 4.121 99.0 0.995 0.010
#> S-value (bits)
#> 750 0.415
#> 500 1.000
#> 250 2.000
#> 200 2.322
#> 150 2.737
#> 100 3.322
#> 50 4.322
#> 25 5.322
#> 10 6.644
ggcurve(curves[[1]], type = "c", nullvalue = 0)
 # A ratio measure; the log transformation is handled internally
or <- curve_from_se(estimate = 1.5, se = 0.2, measure = "ratio")
ggcurve(or[[1]], type = "c", measure = "ratio", nullvalue = 1)
# A ratio measure; the log transformation is handled internally
or <- curve_from_se(estimate = 1.5, se = 0.2, measure = "ratio")
ggcurve(or[[1]], type = "c", measure = "ratio", nullvalue = 1)