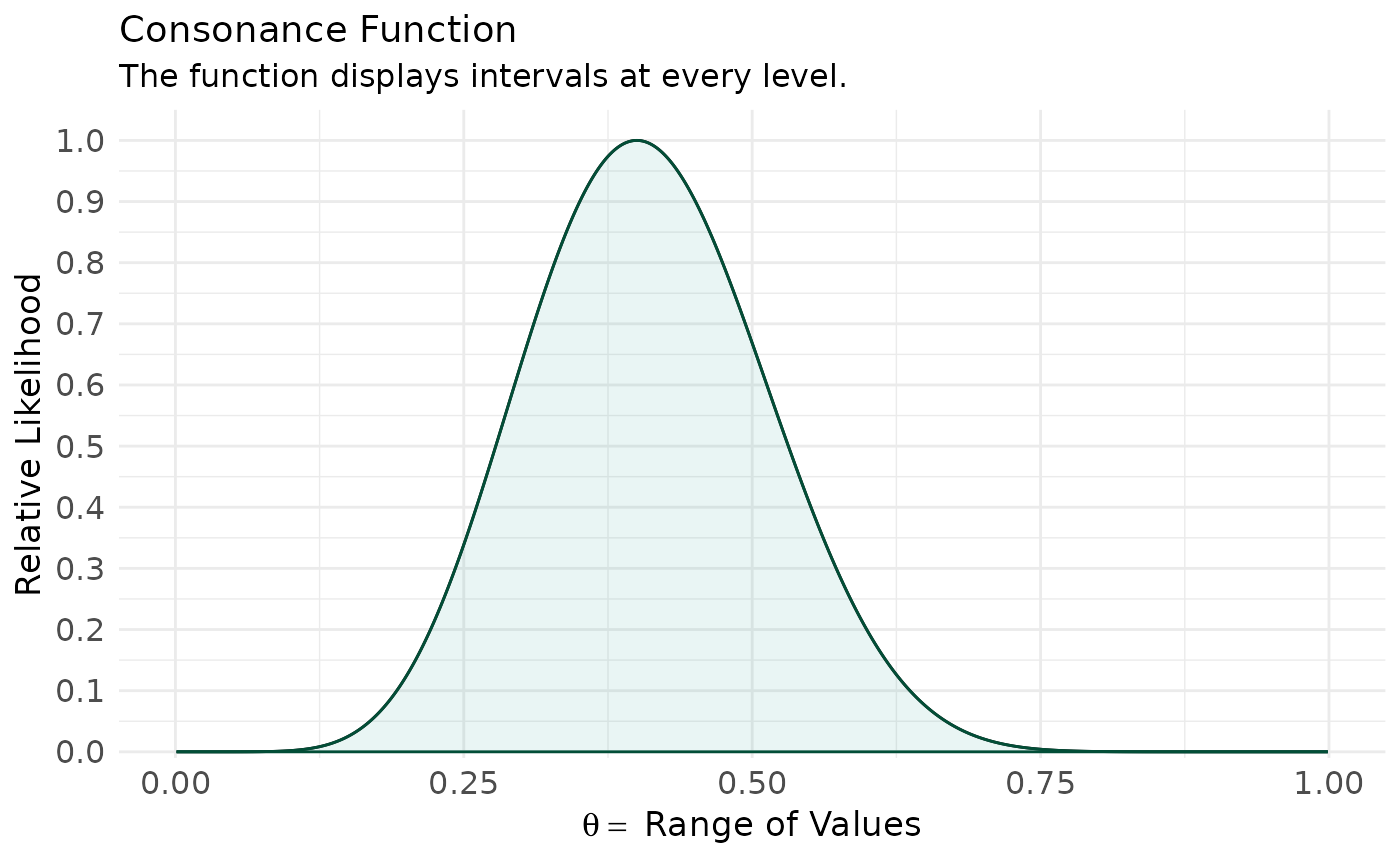
Package A Log-Likelihood Grid As A concurve Likelihood Object
Source:R/curve_likelihood.R
as_curve_lik.RdTakes a grid of parameter values and the corresponding (profile)
log-likelihood and returns the same object structure as curve_lik(),
so all of concurve's plotting and tabling functions work on it.
This is the bridge between any likelihood-producing tool
(optim(), maxLik, bbmle, ProfileLikelihood,
hand-coded exact likelihoods) and concurve.
as_curve_lik(values, loglik, table = TRUE)Arguments
- values
A numeric vector of parameter values (the grid).
- loglik
A numeric vector of log-likelihood values evaluated at
values. Any additive constant is allowed; the function normalizes internally so the maximum relative likelihood is 1.- table
Indicates whether or not a table output with some relevant statistics should be generated. The default is TRUE and generates a table which is included in the list object.
Value
A list with 2 items where the dataframe of values is in the
first object, and the table for the values in the second if
table = TRUE. The dataframe holds values,
likelihood, loglikelihood (relative, maximum 0),
support (relative likelihood in (0, 1]), and
deviancestat, the likelihood-ratio statistic
\(D = -2\log(L/\hat{L})\) on the \(\chi^2_1\) scale, so that the
\(1/6.83\) support cutoff corresponds to \(D = 3.84\).